User Group Management
All re-useable components needed to build this section can be found on the following 3 pages


http://tologix-p3-inventory.s3-website.ca-central-1.amazonaws.com/users.html
http://tologix-p3-inventory.s3-website.ca-central-1.amazonaws.com/user-group.html
http://tologix-p3-inventory.s3-website.ca-central-1.amazonaws.com/edit-user-group.html
This script will need to be added to the <head> of the page to enable the chart.js library:
<script type="text/javascript" src="https://cdn.jsdelivr.net/npm/chart.js@2.8.0/dist/Chart.min.js"></script>
An example of the chart rendering can be found on the User Group page here:
http://tologix-p3-inventory.s3-website.ca-central-1.amazonaws.com/user-group.html
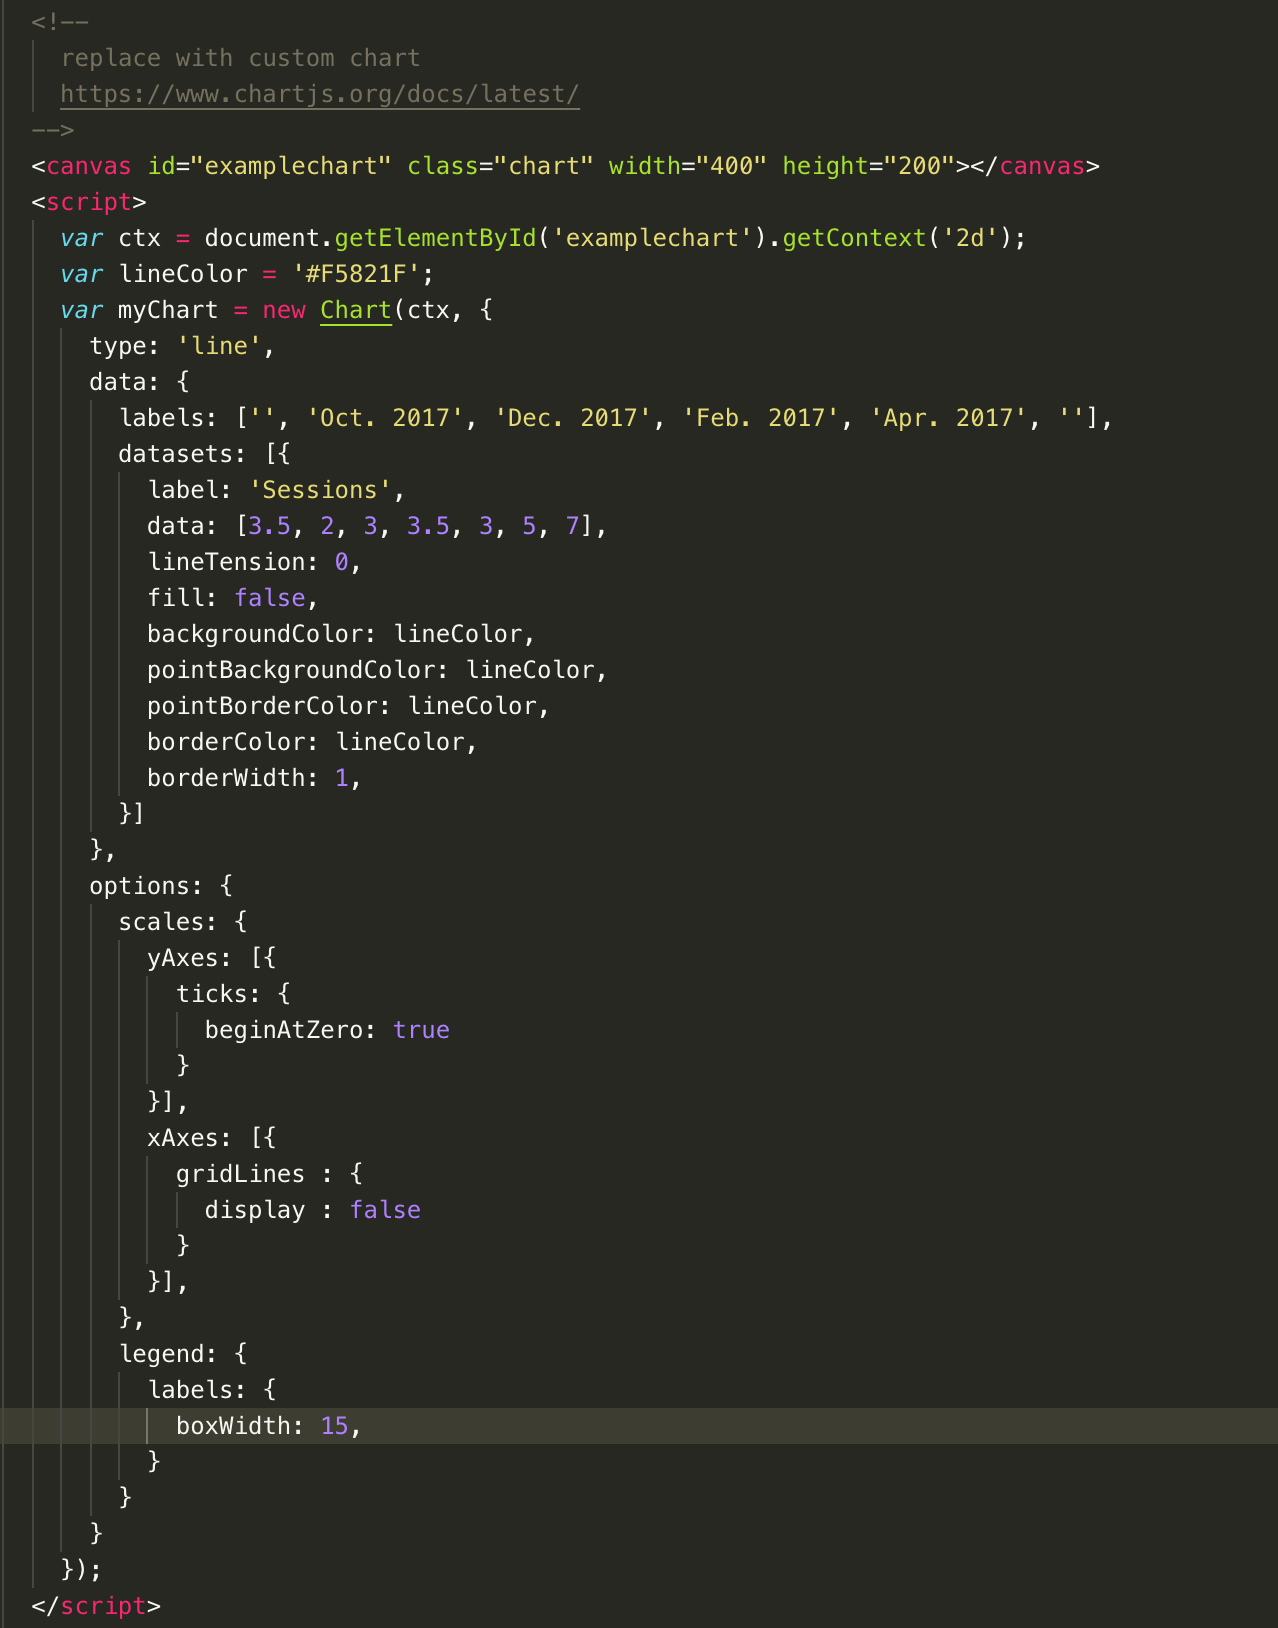
Chart.js has great documentation for how to display all kinds of visual data.
For the graph illustrating usage data, the y axis displays data by Month. However, have incorporate the same requirements as the current application where the date units shit from days, weeks, and months depending on the date range? If not, we should ensure that it adjusts based on the following:
Thanks,
Morgan
All data in the graph is completely configurable and controllable by setting the data passed to the charting library.
This data will have to be set dynamically in the actual application.
An example of what that code looks like is in the screenshot above. I just threw in some dummy data just to get something to display in a chart format.
To get the functionality you are describing, it would be as easy as outputting 3 separate charts on the page, controlled via a tab interface like you see throughout the application, or we can come up with a separate designed UI element for it if you so choose.
Morgan